How a Simple A/B Test Doubled Our Chatbot Engagement

In a previous post about using metrics to test hypotheses, I wrote about my experience working with my friends at Tierra Project (who just launched their web3 app at https://www.tierra.live, so kudos to them).
Well, keeping with that tune, today I'm going to write about another thing I got to practice and test firsthand with them: running experiments to measure the effectiveness of changes in our products.
What I'll show today is how we set up an A/B test and let it run for a week to see whether users would engage in more conversations with the AI chatbot we built for their app.
Even though this example is based on a simple feature change, I learned there's more to it than just checking that the metrics beat the control numbers.
Disclaimer: We used PostHog to analyse app metrics and I'll share screenshots of the resources created there, but I'm not getting paid (or anything like it) for promoting it.
Context
After pivoting from the Social dApp approach (see my previous post about it), the founders turned their attention toward AI because every investor was talking about it.
We figured the easiest way to show we had AI in our products was to include a simple chatbot—nicknamed Bailoo—to serve as a natural‑language interface for the app. Something like this:
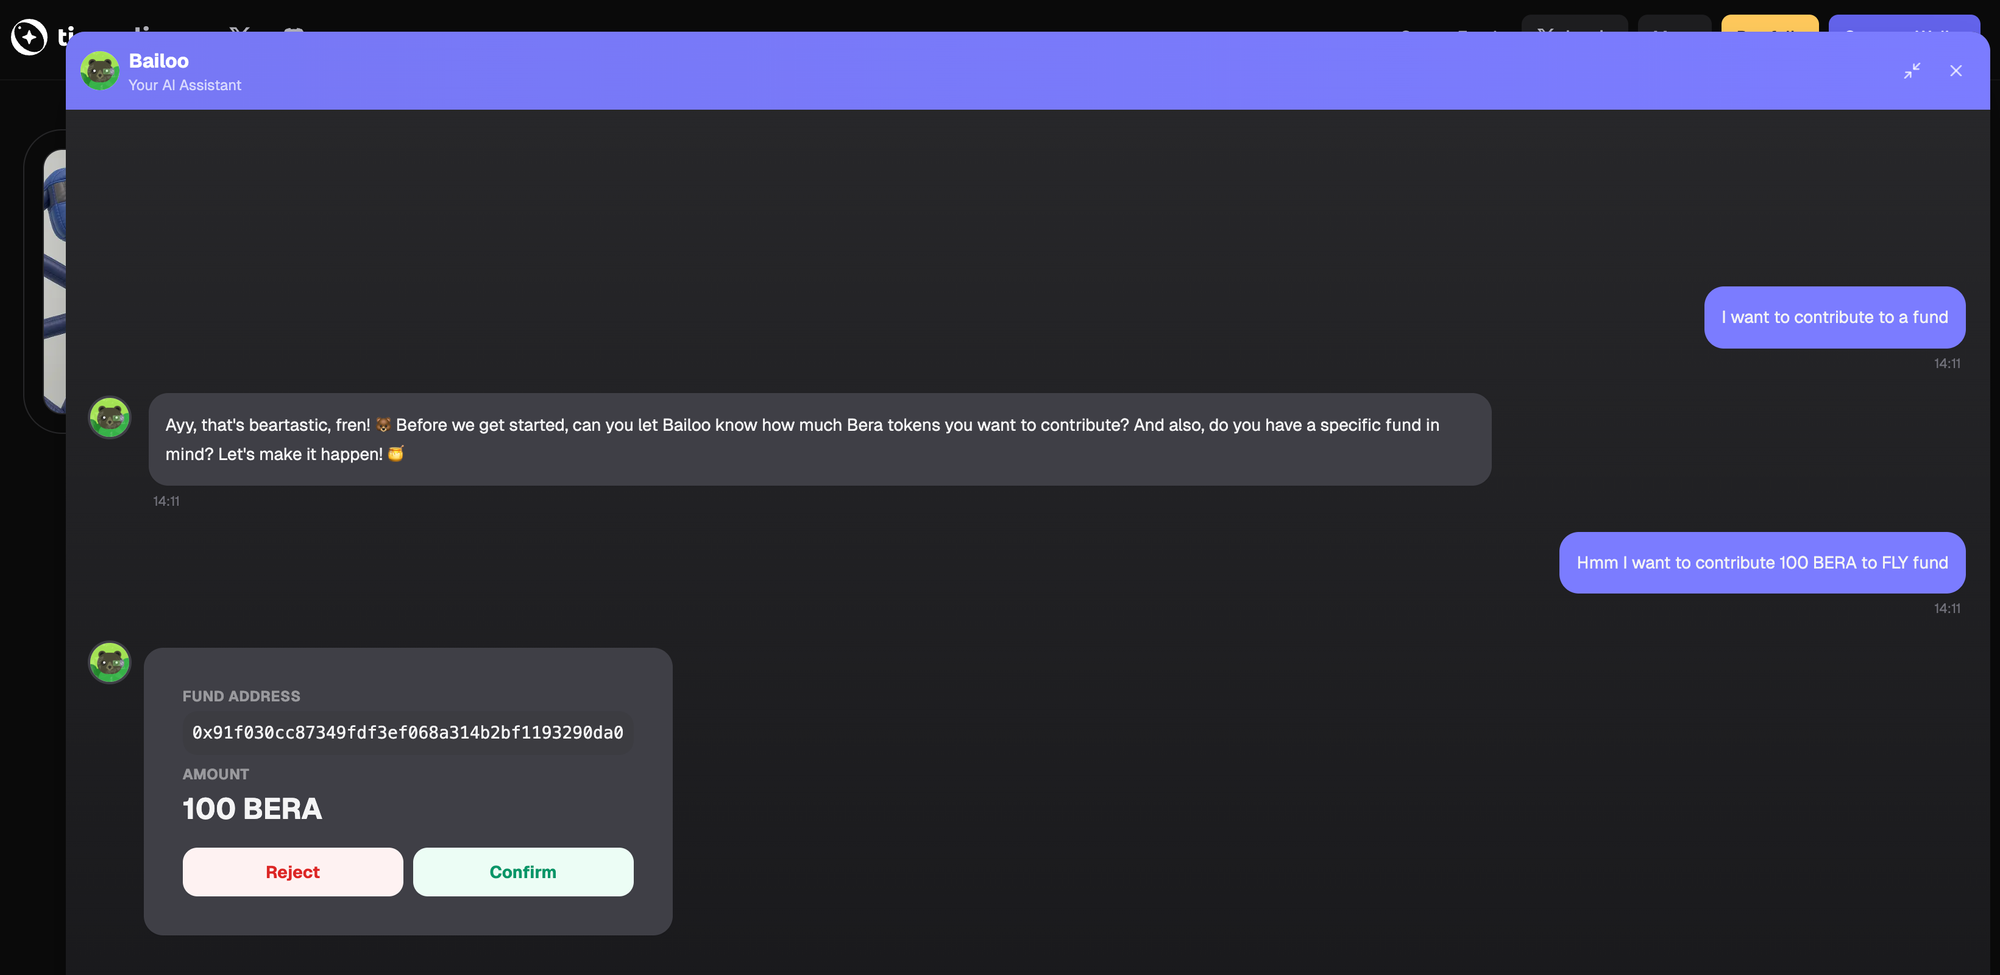
You can try it yourself at https://www.tierra.live. It doesn't matter if you're not crypto‑savvy—the bot will happily explain what it's about.
While most of the team focused on the app itself, another founder and I focused on building the chatbot. That gave us a shot at trying something new and planning a roadmap for a likely new product.
Once we deployed it, we used it to draw attention from investors and users, but we noticed that not many people were actually chatting with Bailoo. That meant we had very few examples to analyse and almost no insight into how users were interacting with the AI.
I wondered if it was because the chat was closed by default, hiding the chatbot’s conversation starters (like “I want to contribute to a fund”). I thought we should open it by default when the page loaded.
The decision seemed obvious, but I still wanted to back it up with data (and it was a great chance to test PostHog’s Experiments feature), so I set it up.
The experiment
Setting up A/B tests was pretty easy—just follow the docs to create your own experiments.
It requires a specific feature flag that you use in your code; the rest can be configured in PostHog. Our code looked like this:
useEffect(() => {
  const featureFlag = posthog.getFeatureFlag("prompt-chat-on-startup");
  setOpenByDefault(featureFlag === "test");
}, [setOpenByDefault, posthog]);
React useEffect to sync the app with PostHog's feature flag
We then used openByDefault to decide whether to open the chatbot widget when the page loaded. If the feature flag returns test, the user is on that experiment variant.
You can add many variants and analyse which performs better in the same experiment—that’s what PostHog calls A/B/n testing.
Next, we instrumented the app to capture events whenever a user sent a message to the chatbot:
const messageSentHandler = useCallback((content: string) => {
    posthog.capture("message-sent", { content });
}, [posthog]);
Handler for `message sent` events that captures the content
In PostHog we added a primary metric based on message-sent events.
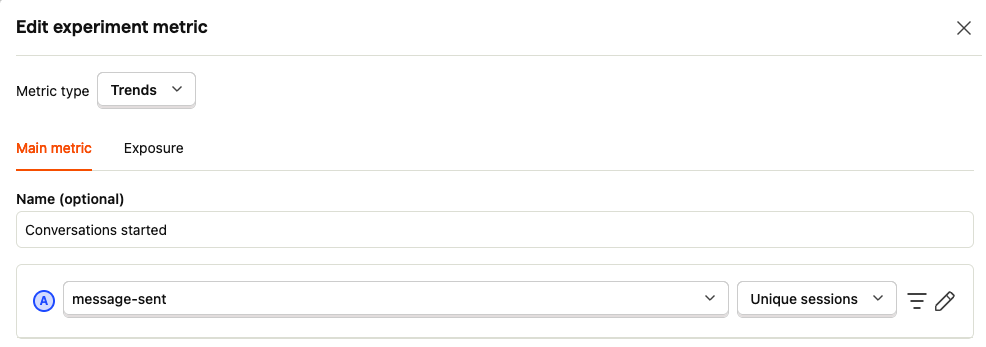
We set it up to count events by unique sessions, so every message-sent event by the same user within a day counts as one—similar to a DISTINCT query grouped by day and user.
Then we let the experiment run for a week to gather enough data.
Results
The experiment ran from January 26 – February 2, 2025 (Sunday to Sunday). In total, both variants were shown to 399 people—202 saw the control variant and 197 saw the test variant.
PostHog marked the test variant as very likely to win. In other words, our hypothesis was probably true.
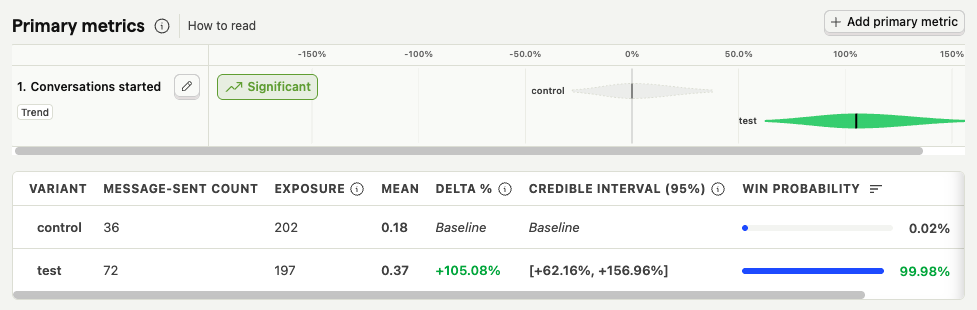
The test variant generated twice as many unique message‑sent events per user and day as the control. Opening the chat by default doubled the chance that a user would start a conversation.
The platform presents the results using a Bayesian engine. The green bar shows the probability distribution of the true result within the 95 % credible interval. The real improvement most likely increases the metric by around 100 % (the delta was 105 %).
The credible interval is wide because of the small sample size (fewer than 400 users). Increasing the sample 10× or 100× could change the outcome, but this was the data we had.
PostHog’s UI did a nice job managing expectations while we waited for each variant to reach at least 100 users.
Conclusion
Running A/B tests is really helpful for understanding how product changes affect user behaviour.
As product engineers, we should make a habit of testing our hypotheses and gathering the data we need to create better products and convince stakeholders of our decisions.
The process is easier with the right tooling. The tool I showed here is just one of many that offer application analytics—do your research and use whatever suits you. What matters is that engineers can create their own views of the data their features generate.
I’ve worked at companies where engineering teams relied on data teams to process and visualise these dashboards. Needless to say, we didn’t do A/B testing as often because of the hassle.
By getting closer to product decisions, engineers get closer to the business, which is my asymmetric bet: supporting the business with technology rather than going deep into technology alone.